

1. Main Points
This publication presents quarterly mortgage and landlord possession statistics up to January to March 2026. In general, we have compared figures to the same quarter in the previous year. Should users wish to compare against previous years, they can do so using the accompanying statistical tables. For technical detail, please refer to the accompanying supporting document published alongside each quarterly publication here: Mortgage and landlord possession statistics – GOV.UK
| Mortgage claims, orders, warrants and mortgage possessions have decreased. | Compared to the same quarter in 2025 there were decreases in mortgage possession claims from 6,767 to 5,181 (23%), orders from 4,602 to 3,749 (19%), and warrants from 3,552 to 3,420 (4%). Repossessions by county court bailiffs remained stable at 1,101, compared to 1,103 in the same quarter of 2025. |
| Landlord possession claims, orders, warrants and repossessions have decreased. | When compared to the same quarter in 2025 there were decreases in landlord possession claims from 23,964 to 22,733 (5%), orders from 18,674 to 16,848 (10%), warrants from 10,929 to 10,172 (7%), and repossessions by county court bailiffs from 7,345 to 6,888 (6%). |
| Mortgage claims decreased across all regions, while landlord claims decreased across all regions except Wales. | Decreases in mortgage possession claims have been recorded across all regions. Landlord possession claims have recorded a decrease in all regions, except Wales where they increased. |
| Median timeliness for mortgage repossessions has increased. | The median average time from claim to mortgage repossession has increased to 45.7 weeks, up from 40.5 weeks in the same period in 2025. The median average time from claim to warrant has increased to 35.6 weeks, up from 30.3 weeks in the same period in 2025. |
| Median timeliness for landlord repossessions has increased. | The median average time from claim to landlord repossession is currently 26.4 weeks, up by 0.3 weeks from the same period in 2025. |
A data visualisation tool has also been published that provides further breakdowns in a web-based application. The tool can be found here.
For feedback related to the content of this publication and visualisation tool, please contact us at CAJS@justice.gov.uk
There have been decreases in both mortgage and landlord repossessions when compared to the same quarter in 2025, while the number of new claims issued have decreased for both over the same period.
The fall in landlord repossessions was seen in private and accelerated landlord types, while social landlord repossessions saw an increase. Private landlord claims and orders rose, and social landlord warrants increased, while the remaining landlord-type measures declined.
The median time between claims and repossessions increased for both mortgage and landlord possessions compared with the same quarter in 2025.
The Renters Rights Act received royal assent on the 27th October 2025, and key changes were implemented on 1st May 2026. The Act gives tenants new rights and introduces new rules for private landlords in England. As it was implemented at the beginning of May, any impact on the statistics contained within this report won t be seen until the data is published in September 2026 when the data for April to June is presented; the first full quarter of operation covering July to September 2026 will be published in December 2026.
3. Overview of Mortgage Possession
Mortgage possession claims, orders, warrants and repossessions have decreased.
Compared to the same quarter in 2025, mortgage possession claims (5,181) are down 23%, mortgage orders for possession (3,749) are down 19%, warrants issued (3,420) are down 4% and repossessions (1,101) are slightly decreased.
Figure 1: Mortgage possession actions in the county courts of England and Wales, January to March 2021 to January to March 2026 (Source: Table 1)
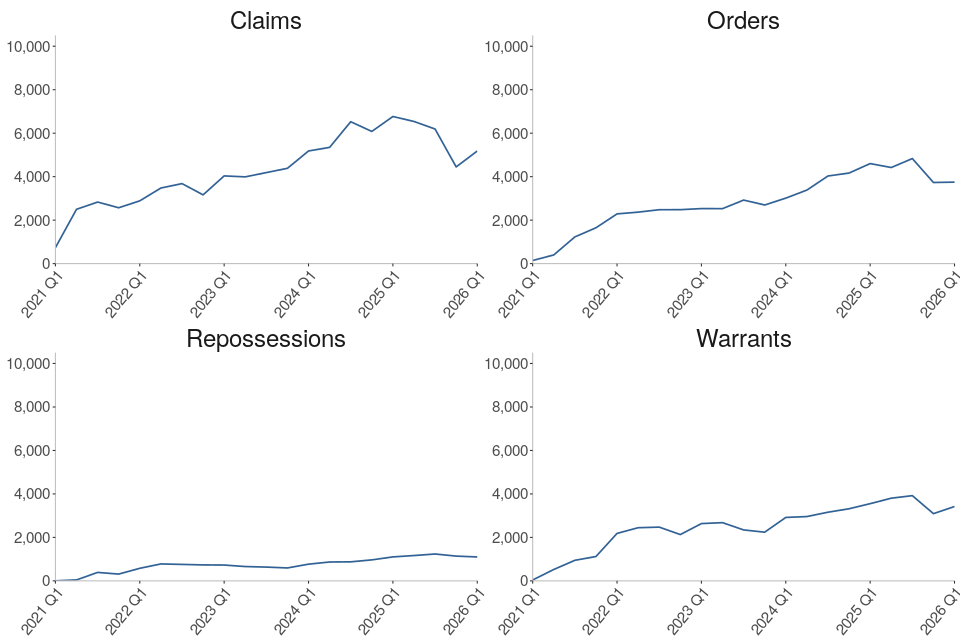
Following Covid-19, mortgage possession claims have generally risen since Q1 2021. In the most recent quarter, Q1 2026, there were 5,181 claims for possession, down 23% from the same quarter in 2025. However, in the latest quarter, mortgage possession claims rose by 16% compared to the previous quarter (Q4 2025).
Orders and warrants for possession have followed a similar trend to mortgage claims. Compared to the same quarter in 2025, orders are down 19% to 3,749 and warrants are down 4% to 3,420 in Q1 2026. The data shows early signs of decreases but it is not yet known if this trend will continue. We will monitor this closely over the next quarters.
4. Mortgage Possession Action Timeliness
Claim to warrant median timeliness has increased by 5.3 weeks while claim to repossession median timeliness has increased by 5.2 weeks compared to the same quarter last year. Median timeliness for claim to order has decreased by 0.5 weeks.
The median average time from claim to repossession has increased to 45.7 weeks, up from 40.5 weeks in the same period in 2025.
Figure 2: Average timeliness of mortgage possession actions, January to March 2021 to January to March 2026 (Source: Table 3)
Number of weeks taken from initial mortgage claim to…
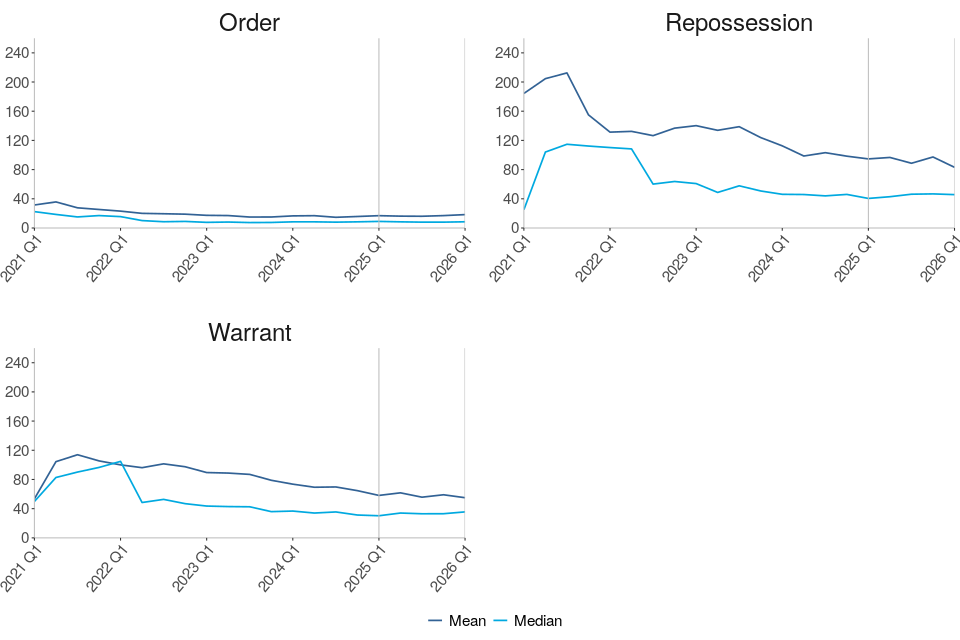
The median time taken to complete mortgage actions has decreased for claims to orders. Claims to warrants, claims to repossession and warrant to repossession median timeliness have increased compared to the same quarter in 2025. This quarter:
-
Claims to order median timeliness is currently 8.5 weeks, down from 9 weeks in the same period in 2025.
-
Claims to warrant median timeliness has increased to 35.6 weeks, up from 30.3 weeks in the same period in 2025.
-
Warrants to repossession median timeliness has increased to 10.1 weeks, up from 9.6 weeks in the same period in 2025.
-
Claims to repossession median timeliness has increased to 45.7 weeks, up from 40.5 weeks in the same period in 2025.
The trend for mortgage possession timeliness is driven by outright orders, which make up more than two thirds of all cases. In the most recent quarter, the median time taken from claim to repossession was 42.3 weeks for outright orders (an increase of 6.4 weeks), and 111.1 weeks for suspended orders (a decrease of 37.6 weeks).
The above charts distinguish between the timeliness of possession claims at different stages of a case. Average time taken from claim to warrant or claim to repossession can fluctuate and is affected by various factors. For example, the final two charts take account of the amount of time between the court order being issued and the claimant, such as the mortgage lender, applying for a warrant of possession.
Median figures are generally considerably lower than mean figures, demonstrating that progression from claim to successive stages can be positively skewed by outlying cases.
In Q4 2025 mean and median time between a warrant being issued to a repossession being carried out has been added to the accompanying tables. For mortgage data these new columns can be found in table 3.
5. Overview of Landlord Possession
The number of landlord possession actions across claims, orders, warrants and repossessions have decreased compared to the same quarter of last year.
Claims (22,733), orders (16,848) warrants (10,172) and repossessions (6,888) decreased by 5%, 10% and 7% and 6% respectively, compared to the same quarter in 2025.
Figure 3: Landlord possession actions in the county courts of England and Wales, January to March 2021 to January to March 2026 (Source: Table 4)
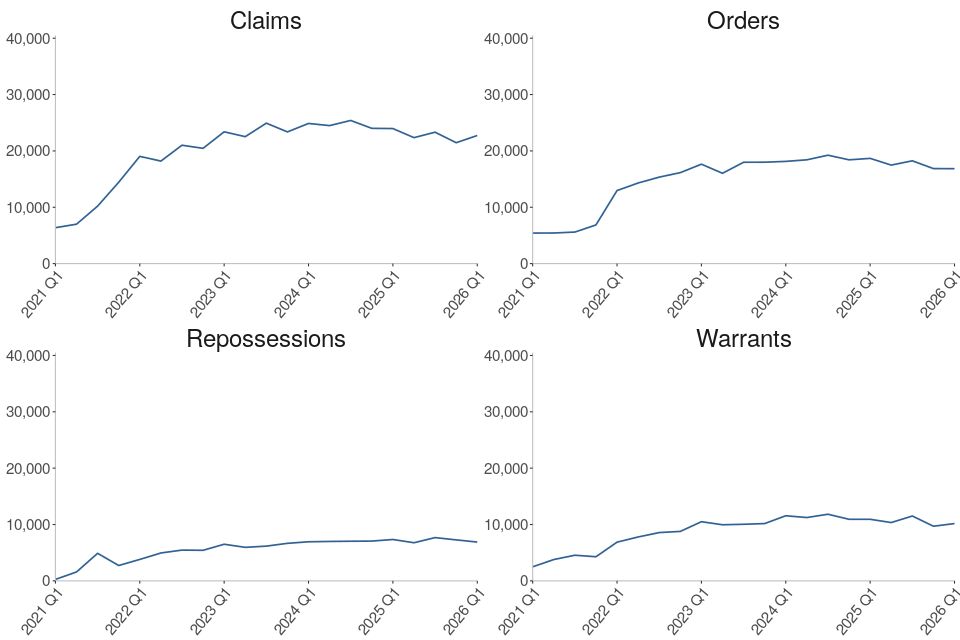
Landlord possession claims showed a general increase from Q2 2021 peaking in Q3 2024 at 25,402. These have fallen overall and are currently at 22,733 in the latest quarter. Within the landlord possession actions, accelerated claims are down 12%, private landlord claims are up 4% and social landlord claims are down 7% compared to the same quarter in 2025. At this time, it is unclear whether the falls in the most recent quarter are due to seasonal variation or a change in behavior in advance of the commencement of the Renters Rights Act on 1st May 2026. We will monitor the trends over the next quarters.
In Q1 2026, 37% (8,505) of all landlord possession claims were social landlord claims, compared to 34% (7,629) private landlord claims and 29% (6,599) accelerated claims. This contrasts with pre-covid proportions when a majority of claims (around 60%) were social landlord claims.
The fall in claim and orders volumes is observed in courts across most geographical regions. As in previous quarters, a concentration was seen in London, with 7,083 landlord claims and 5,278 landlord orders at London courts in Q1 2026, accounting for 31%, and 31% each of the respective totals. In London, there was a decrease of 9% (from 7,799 in Q1 2025) for landlord claims and a decrease of 14% for landlord orders (from 6,124 in Q1 2025).
The 7% decrease in landlord warrants compared to Q1 2025, was driven by a decrease in London. The largest regional number (3,387) was again found in London, making up 33% of all landlord warrants. There was a decrease of 6% for landlord warrants in London (from 3,612 in Q1 2025).
The Housing Loss Prevention Advice Service (HLPAS) provides advice to tenants and homeowners as soon as they are served with a written notice asking them to leave their home. Individuals who require the service do not need to meet legal aid financial eligibility rules as the service is not means tested but they are required to show evidence that they are at risk of losing their home. More information can be found here.
The Renters Rights Act received royal assent on the 27th October 2025, and key changes were implemented on 1st May 2026. The Act gives tenants new rights and introduces new rules for private landlords in England. As it was implemented at the beginning of May, any impacts on the statistics contained within this report won t be seen until the data is published in September 2026 when the data for April to June is presented; the first full quarter of operation covering July to September 2026 will be published in December 2026. We will investigate the disaggregation of the data within this report to enable interpretation of any impacts on activity within the rented sector, and will continue to monitor changes as the act is implemented. Further information on the act can be found here: Guide to the Renters Rights Bill – GOV.UK.
6. Landlord Possession Timeliness
Median timeliness figures for landlord claims to orders have decreased by 0.3 weeks and claims to warrants has remained relatively stable compared to the same period of 2025, while repossession timeliness increased by 0.3 weeks over the same period.
Figure 4: Average timeliness of landlord possession actions, January to March 2021 to January to March 2026 (Source: Table 6)
Number of weeks taken from initial landlord claim to…
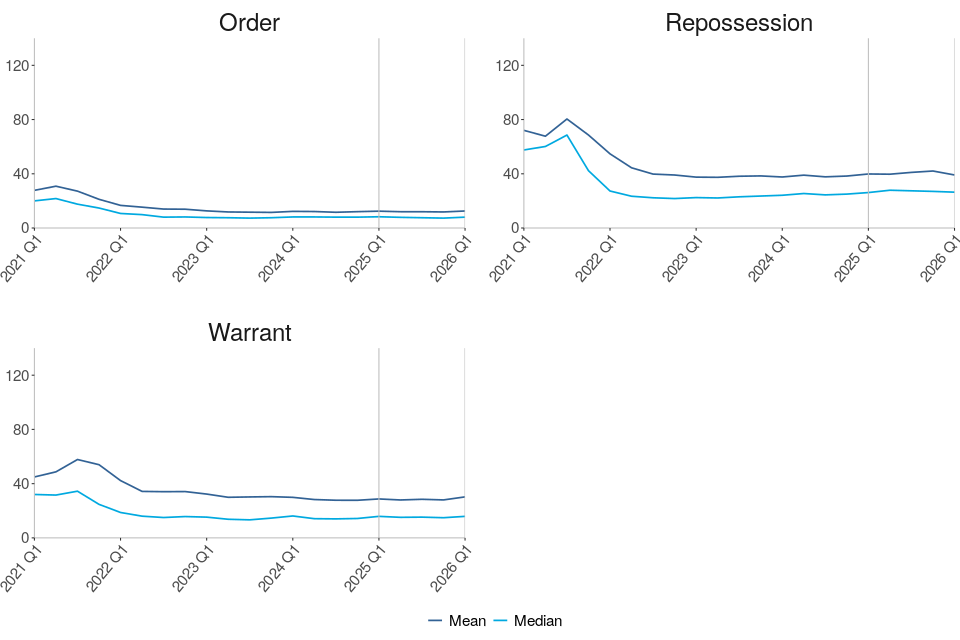
The median time taken to complete landlord actions increased for warrants and repossessions this quarter.
-
Claims to order median timeliness is currently 8.0 weeks, unchanged from the same period in 2025.
-
Claims to warrant median timeliness is currently 15.9 weeks, unchanged from 15.9 weeks in the same period in 2025.
-
Warrants to repossessions median timeliness has decreased to 9.4 weeks, down from 10.1 weeks in the same period in 2025.
-
Claims to repossessions median timeliness is currently 26.4 weeks, slightly increased from the same period in 2025.
As shown in Figure 4, median figures are generally considerably lower than mean figures, demonstrating that progression from claim to successive stages can be positively skewed by outlying cases.
In Q4 2025 mean and median time between a warrant being issued to a repossession being carried out has been added to the accompanying tables. For landlord data these new columns can be found in table 6.
7. Regional Possession Claims
City of London had the highest overall rate of mortgage claims at 588 per 100,000 households owned by a mortgage or loan.
Private landlord claims were highest in Barking and Dagenham with 671 per 100,000 households owned by a private landlord.
Social landlord claims were highest in Dartford with 634 per 100,000 households owned by a social landlord.
Since Q4 2022, the methodology used for calculating the rates of possession claims and repossessions has been modified to take into account the variation in proportions of tenure types in each local authority (LA) as measured by the 2021 census. More information on this change is provided in the accompanying guide to this publication here.
The Isles of Scilly and the City of London have very small populations (ranked 309th and 308th out of 309 respectively for population size) therefore rates may be less robust.
Figure 5: Mortgage possession Claims per 100,000 households owned by a mortgage or loan, January to March 2026 (Source: map.csv; see supporting guide)
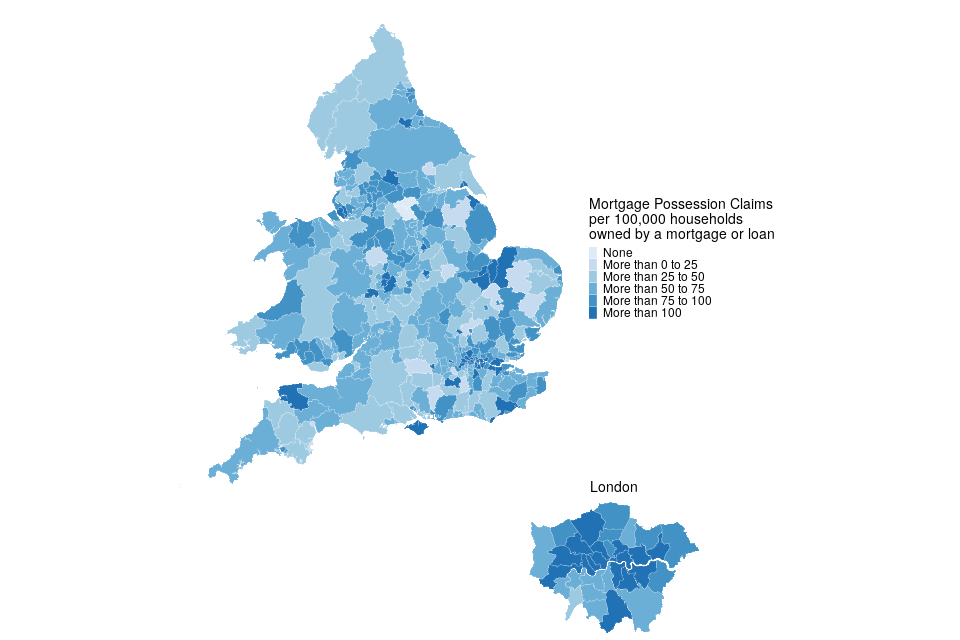
| Local Authority | Rate (per 100,000 households owned by a mortgage or loan) | **Actual number ** |
|---|---|---|
| City of London | 588 | <10 |
| Westminster | 223 | 24 |
| Newham | 163 | 34 |
London boroughs accounted for 9 of the 10 local authorities with the highest rate of mortgage claims. City of London, in the London region, had the highest rate of mortgage possession claims at 588 per 100,000 households owned by mortgage or loan, followed by Westminster (London region) and Newham (London region); with 223 and 163 claims per 100,000 respectively.
Exeter had the lowest rate of mortgage claims (7.3 per 100,000 households owned by a mortgage or loan).
Figure 6: Private landlord possession Claims per 100,000 households owned by a private landlord, January to March 2026 (Source: map.csv; see supporting guide)
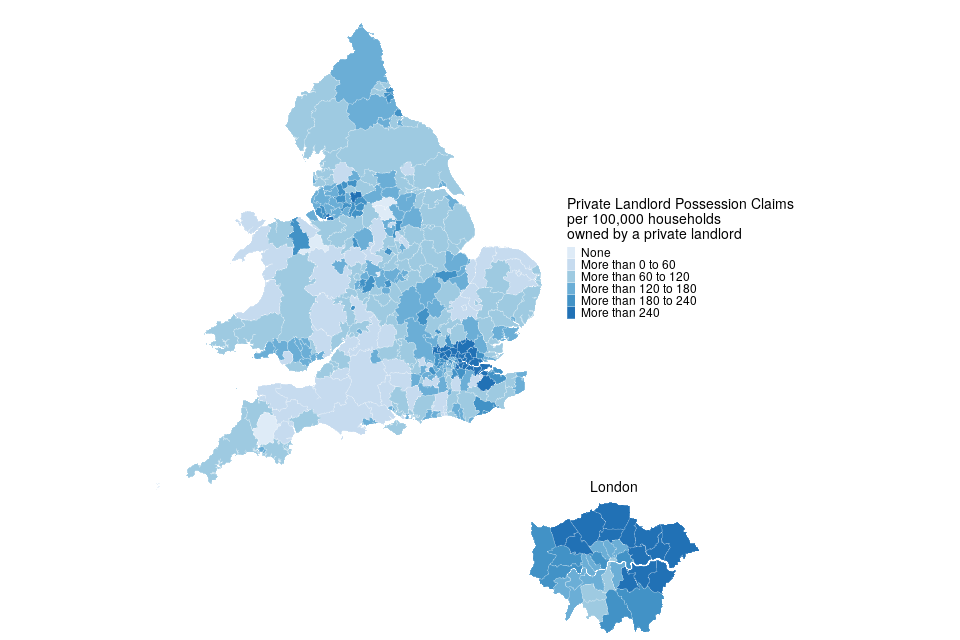
| Local Authority | Rate (per 100,000 households owned by a private landlord) | Actual number |
|---|---|---|
| Barking and Dagenham | 671 | 120 |
| Newham | 515 | 229 |
| Enfield | 478 | 169 |
London boroughs accounted for 8 of the 10 local authorities with the highest rate of private landlord claims. Barking and Dagenham (London region) had the highest rate for private landlord claims (671 per 100,000 households owned by a private landlord), followed by Newham (London region) and Enfield (London region) with 515 and 478 claims per 100,000 households owned by a private landlord respectively.
3 local authorities had no private landlord claims during this period. Excluding these, Exeter had the lowest rate of private landlord claims (15.3 per 100,000 households owned by a private landlord).
Figure 7: Social landlord possession Claims per 100,000 households owned by a social landlord, January to March 2026 (Source: map.csv; see supporting guide)
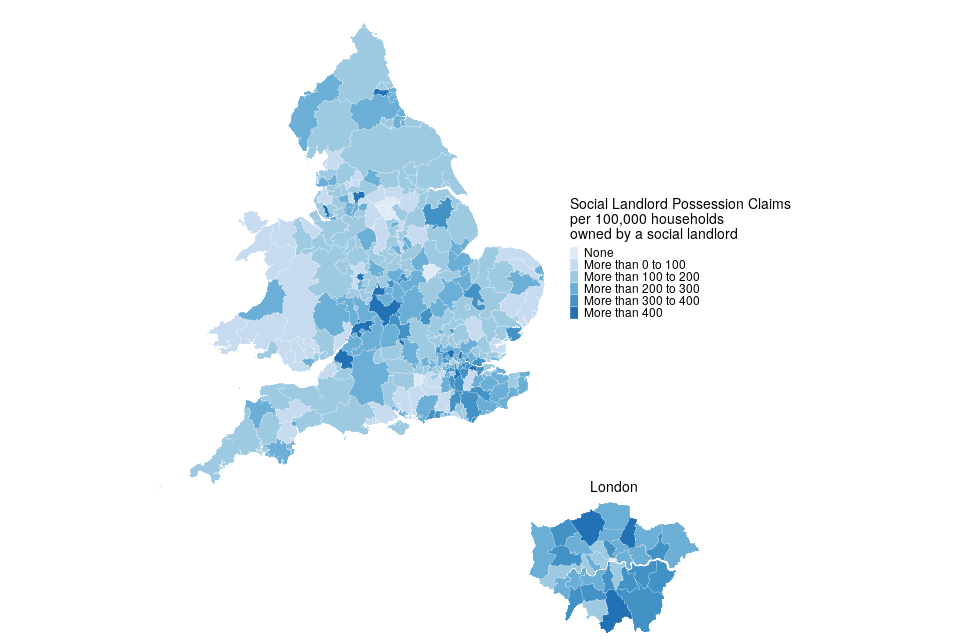
| Local Authority | Rate (per 100,000 households owned by a social landlord) | Actual number |
|---|---|---|
| Dartford | 634 | 40 |
| Tewkesbury | 596 | 31 |
| Barnet | 549 | 110 |
London boroughs accounted for 2 of the 10 local authorities with the highest rate of social landlord claims. Dartford (South East region) had the highest social landlord possession claim rate with 634 per 100,000 households owned by a social landlord. This was followed by Tewkesbury (South West region) and Barnet (London region) with 596 and 549 per 100,000 households owned by a social landlord respectively.
6 local authorities had no social landlord claims during this period. Excluding these, Merthyr Tydfil had the lowest rate of social landlord claims (17.8 per 100,000 households owned by a social landlord).
8. Regional Repossessions (by County Court Bailiffs)
Middlesbrough had the highest overall rate of mortgage repossessions at 107 per 100,000 households owned by a mortgage or loan.
Private landlord repossessions were highest in Barking and Dagenham with 274 per 100,000 households owned by a private landlord.
Social landlord repossessions were highest in Redditch with 191 per 100,000 households owned by a social landlord.
The Isles of Scilly and the City of London have very small populations (ranked 309th and 308th out of 309 respectively for population size) therefore rates may be less robust.
Figure 8: Mortgage repossessions per 100,000 households owned by a mortgage or loan, January to March 2026 (Source: map.csv; see supporting guide)
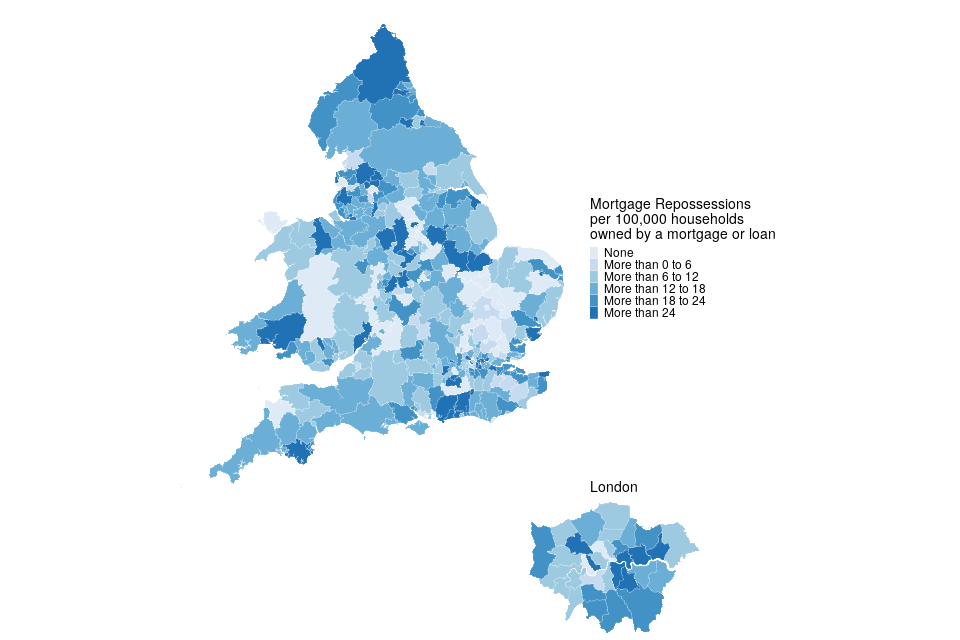
| Local Authority | Rate (per 100,000 households owned by a mortgage or loan) | Actual number |
|---|---|---|
| Middlesbrough | 107 | 17 |
| Tower Hamlets | 87 | 16 |
| North Warwickshire | 56 | <10 |
Local authorities in London account for 2 of the 10 boroughs with the highest rate of mortgage repossessions.
No repossessions by county court bailiffs were recorded during this period in 47 local authorities out of a total of 318.
Figure 9: Private landlord repossessions per 100,000 households owned by a private landlord, January to March 2026 (Source: map.csv; see supporting guide)
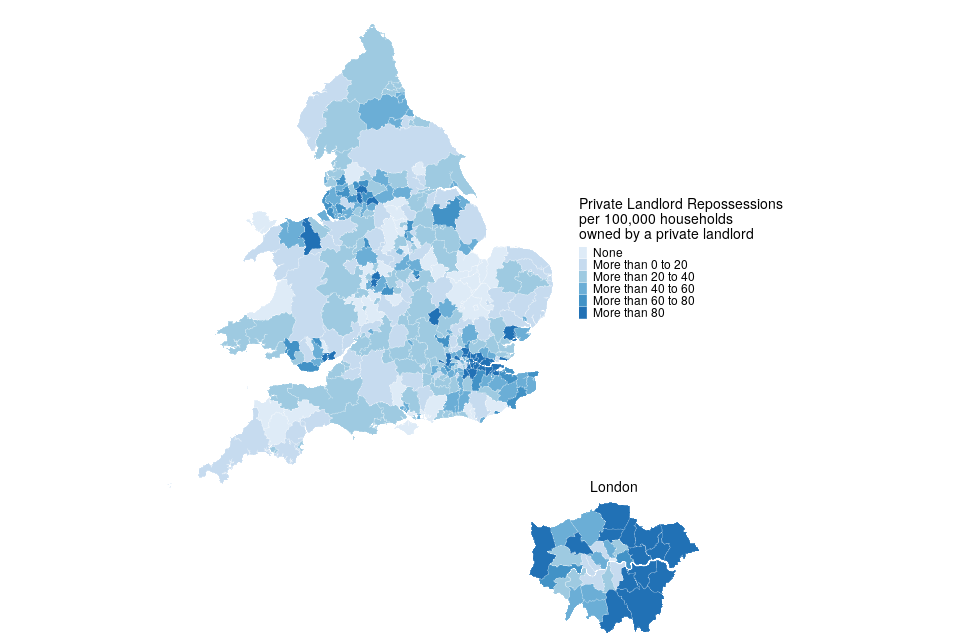
| **Local Authority ** | Rate (per 100,000 households owned by a private landlord) | Actual number |
|---|---|---|
| Barking and Dagenham | 274 | 49 |
| Newham | 205 | 91 |
| Lewisham | 192 | 64 |
London local authorities account for 8 of the 10 boroughs with the highest rate of private landlord repossessions.
40 local authorities had no private landlord repossessions by county court bailiffs in Q1 2026.
Figure 10: Social landlord repossessions per 100,000 households owned by a social landlord, January to March 2026 (Source: map.csv; see supporting guide)
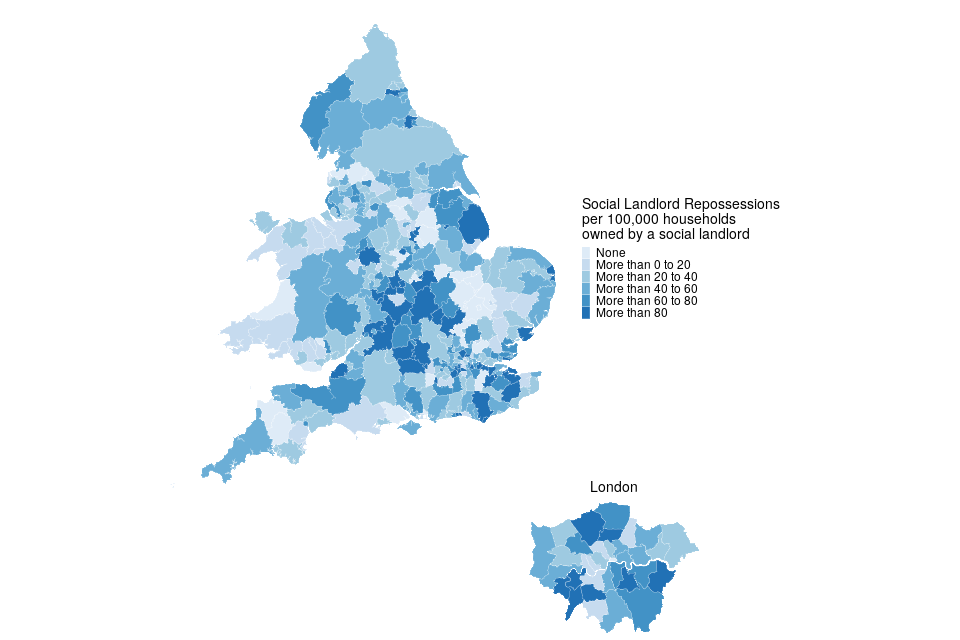
| **Local Authority ** | Rate (per 100,000 households owned by a social landlord) | **Actual number ** |
|---|---|---|
| Redditch | 191 | 14 |
| Kingston upon Thames | 152 | 11 |
| Lincoln | 145 | 13 |
South East local authorities accounted for 2 of the 10 boroughs with the highest rate of social landlord repossessions.
32 local authorities had no social landlord repossessions by county court bailiffs in Q1 2026.
As with claims, it should be noted that for some of these areas the rates are based on a small number of repossessions.
9. Further information
The statistics in the latest quarter are provisional and revisions may be made when the next edition of this bulletin is published. If revisions are needed in subsequent quarters, these will be annotated in the tables.
9.1 Accompanying files
As well as this bulletin, the following products are published as part of this release:
-
A supporting guide providing further information on how the data is collected and processed, including a guide to the csv files, as well as legislation relevant to mortgage possessions and background information.
-
A set of overview tables (also available in accessible format), covering key sections of this bulletin.
-
CSV files of the map data and the possession action volumes by local authority and county court.
-
A data visualisation tool which provides a detailed view of the Mortgage and Landlord statistics. We welcome feedback on this tool to help improve it in later editions and to ensure it meets user needs.
These can be found here: https://www.gov.uk/government/statistics/mortgage-and-landlord-possession-statistics-january-to-march-2026
9.2 Accredited Official Statistics
Accredited official statistics are statistics (https://osr.statisticsauthority.gov.uk/accredited-official-statistics/) that meet the highest standards of trustworthiness, quality and public value.
Accredited official statistics are called National Statistics in the Statistics and Registration Service Act 2007. These accredited official statistics were independently reviewed by the Office for Statistics Regulation in September 2021. They comply with the standards of trustworthiness, quality and value in the Code of Practice for Statistics and should be labelled accredited official statistics .
It is the Ministry of Justice s responsibility to maintain compliance with the standards expected for National Statistics. If we become concerned about whether these statistics are still meeting the appropriate standards, we will discuss any concerns with the Authority promptly. Accredited Official Statistics status can be removed at any point when the highest standards are not maintained, and reinstated when the standards are restored. These statistics have been audited and re-accredited as Accredited Official Statistics. The most recent compliance check completed by the Office of Statistics Regulation can be found
here.
9.3 Future publications
Our statisticians regularly review the content of publications. Development of new and improved statistical outputs is usually dependent on reallocating existing resources. As part of our continual review and prioritisation, we welcome user feedback on existing outputs including content, breadth, frequency and methodology. Please send any comments you have on this publication including suggestions for further developments or reductions in content.
9.4 Contact
Press enquiries should be directed to the Ministry of Housing, Communities and Local Government press office:
email: newsdesk@communities.gov.uk
Other enquiries and feedback on these statistics should be directed to the Courts and People unit of the Ministry of Justice:
Carly Gray – email: CAJS@justice.gov.uk
Next update: 13 August 2026
Crown Copyright
Produced by the Ministry of Justice