

hirun/iStock via Getty Images
Investment Approach
- Fidelity® Real Estate Investment Portfolio seeks above-average income and long-term capital growth, consistent with reasonable investment risk, by investing in securities of companies that own and, in most cases, operate commercial real estate properties.
- Investment in real estate securities has the potential to provide portfolio diversification, consistent income generation, total return and the ability to outpace inflation.
- We believe real estate investment trusts (REITs) represent a balance between real estate and stocks, and that recognizing attributes of both is key to identifying opportunities to outperform.
- Through rigorous bottom-up research from both Fidelity’s dedicated real estate team and the firm’s broader research resources, we strive to add value through security selection within a disciplined risk framework. Our process seeks to determine the relative attractiveness of individual REITs and will try to take advantage of pricing discrepancies in the market.
|
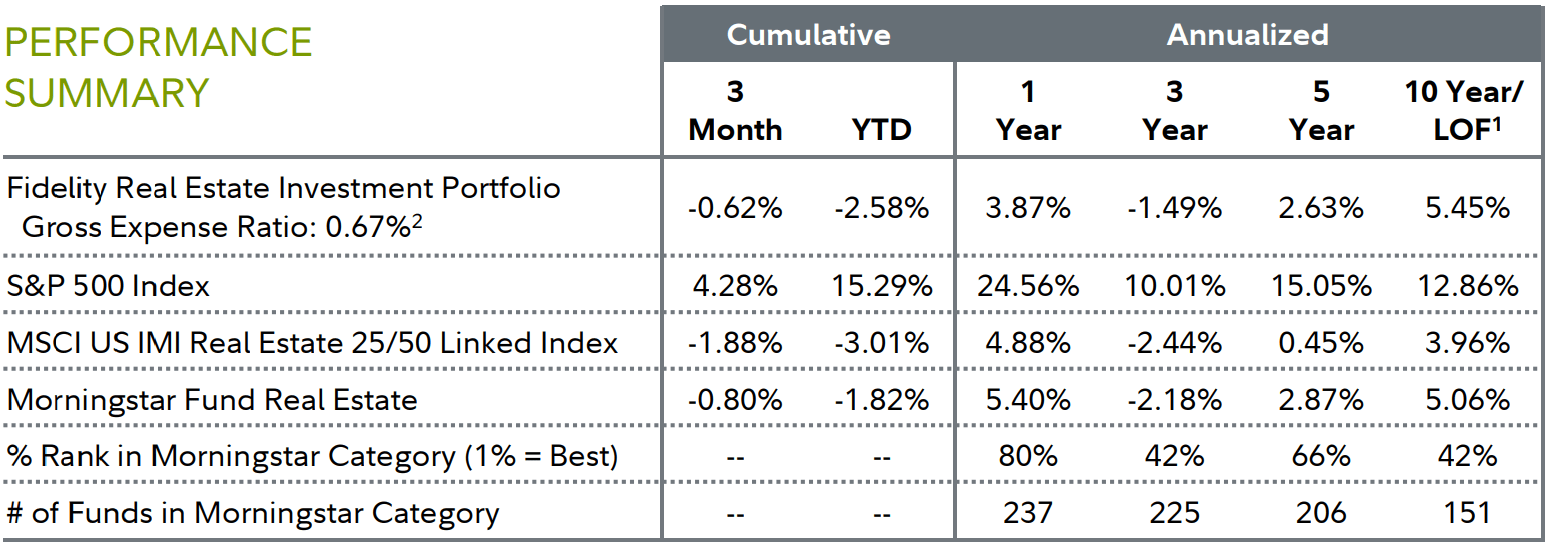
1 Life of Fund (LOF) if performance is less than 10 years. Fund inception date: 11/17/1986. 2 This expense ratio is from the most recent prospectus and generally is based on amounts incurred during the most recent fiscal year, or estimated amounts for the current fiscal year in the case of a newly launched fund. It does not include any fee waivers or reimbursements, which would be reflected in the fund’s net expense ratio. Past performance is no guarantee of future results. Investment return and principal value of an investment will fluctuate; therefore, you may have a gain or loss when you sell your shares. Current performance may be higher or lower than the performance stated. Performance shown is that of the fund’s Retail Class shares (if multiclass). You may own another share class of the fund with a different expense structure and, thus, have different returns. To learn more or to obtain the most recent month-end or other share-class performance, visit Fidelity Funds | Mutual Funds from Fidelity Investments, Financial Professionals | Fidelity Institutional, or Fidelity NetBenefits | Employee Benefits. Total returns are historical and include change in share value and reinvestment of dividends and capital gains, if any. Cumulative total returns are reported as of the period indicated. For definitions and other important information, please see the Definitions and Important Information section of this Fund Review. |
Market Review
For the second quarter of 2024, the U.S. real estate investment trust market, as measured by the MSCI U.S. IMI Real Estate 25/50 Linked Index, returned -1.88%, lagging the 4.28% gain in the broad U.S. stock market, according to the S&P 500® index.
Amid a largely favorable backdrop for higher-risk assets, the S&P 500®index continued its late-2023 momentum and reached midyear just shy of its all-time closing high. The backdrop for the global economy and earnings growth remained largely constructive, underpinning fairly low market volatility. The move toward global monetary easing inched forward, although persistent core inflation in the U.S. continued to keep the Fed on hold. Looking ahead, the pace and magnitude of global monetary easing remains uncertain, while near-term risk of a recession in the U.S. appears muted.
In April, the S&P 500®returned -4.08%, as inflation remained stickier than expected, spurring doubts of a soft landing for the economy. Reversing course, the S&P 500®rose 4.96% in May. Tech stocks, particularly AI-related names, came back into focus, while the bull market finally began to reflect broader participation. At its June meeting, the Fed bumped up its inflation forecast and reduced its outlook from three cuts to one in 2024. The market followed suit, reducing its rate-cut expectations for the second straight quarter. Still, signs of inflation easing helped the index gain 3.59% for the month, boosting its year-to-date result to 5.29%.
Against this backdrop, REIT stocks declined this quarter amid heightened uncertainty surrounding the direction of interest rates. A resilient economy, coupled with inflation that remains higher than desired, led investors to believe that rate cuts by the U.S. Federal Reserve in 2024 may be less likely. Additionally, growth-oriented equities continued to attract most investor attention, leaving income-oriented and defensive sectors, including REITs, lagging in a growth-focused market.
Performance was mixed across real estate industries in the benchmark, with most producing a negative return. Multi-family residential, or apartment REITs, fared best (+12%), benefiting from continued strong demand despite increased supply. Health care REITs (+8%) also had favorable results, while timber (-19%), real estate services (-13%) firms and hotel & resort REITs (-12%) notably declined.
Performance Review
For the second quarter, the fund returned -0.62%, outpacing the -1.88% result of the benchmark, the MSCI U.S. IMI Real Estate 25/50 Linked Index.
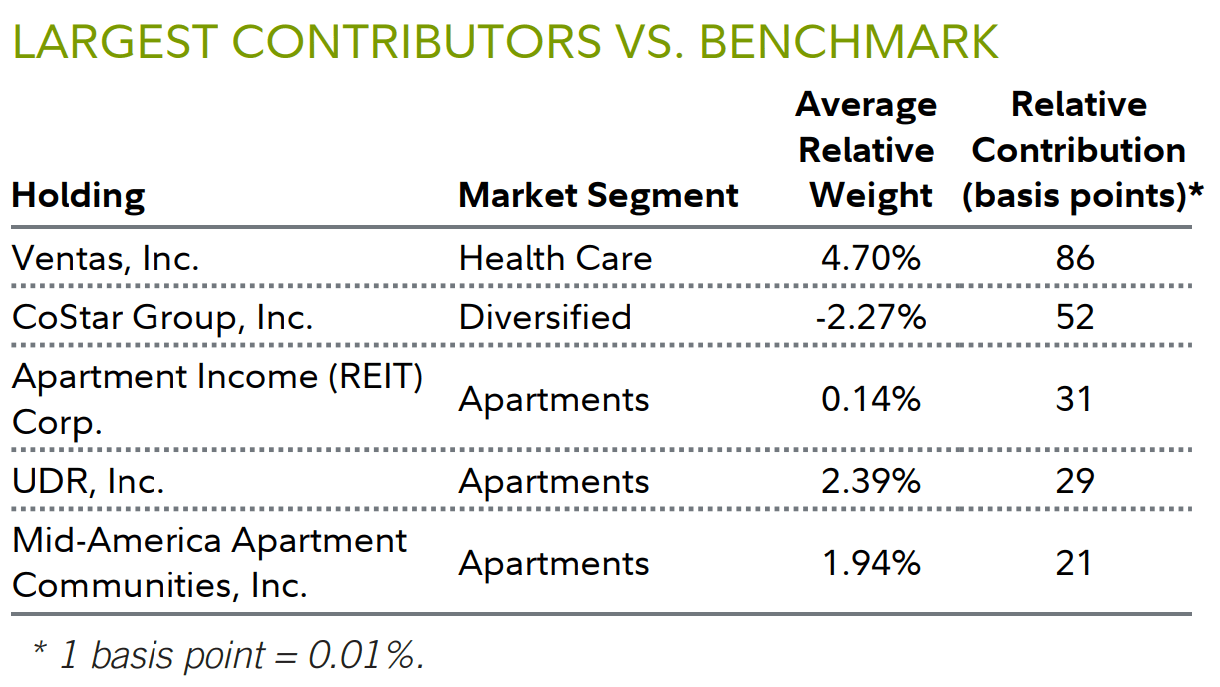
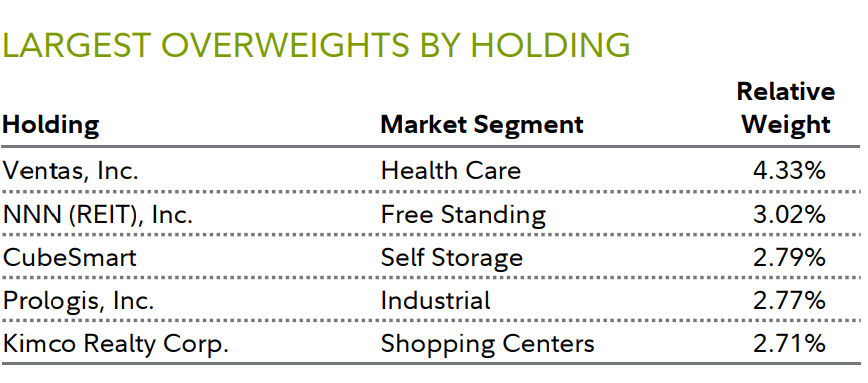
Security selection among health care REITs contributed the most to the fund’s performance versus the industry index in Q2, led by our large overweight in Ventas (VTR). Its shares gained about 18% the past three months, trending higher beginning in May, after the senior-housing real estate investment trust reported quarterly financial results that exceeded consensus estimates. Accelerated occupancy growth and improved senior-housing triple-net coverage aided the strong Q1, as did a favorable revision in financial guidance for 2024.
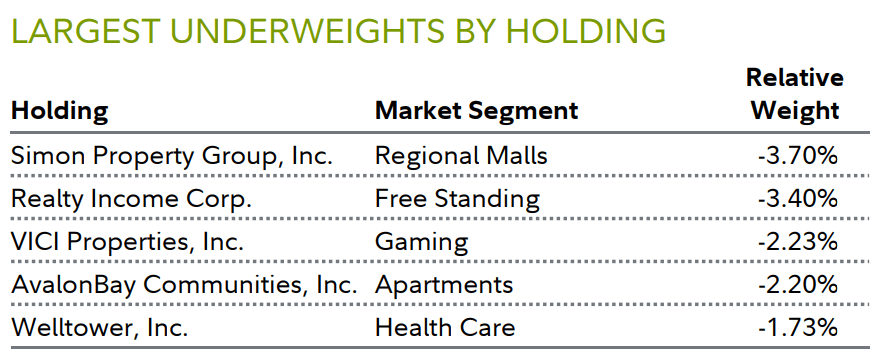
We continued to like Ventas, the fund’s fourth-largest holding on June 30, for its ability to capitalize upon the favorable supply-demand environment for senior housing operators. Tempering the outperformance in the health care industry, however, was our underweight position in Ventas’ leading competitor, Welltower (WELL) (+12%). We preferred Ventas for its more attractive valuation.
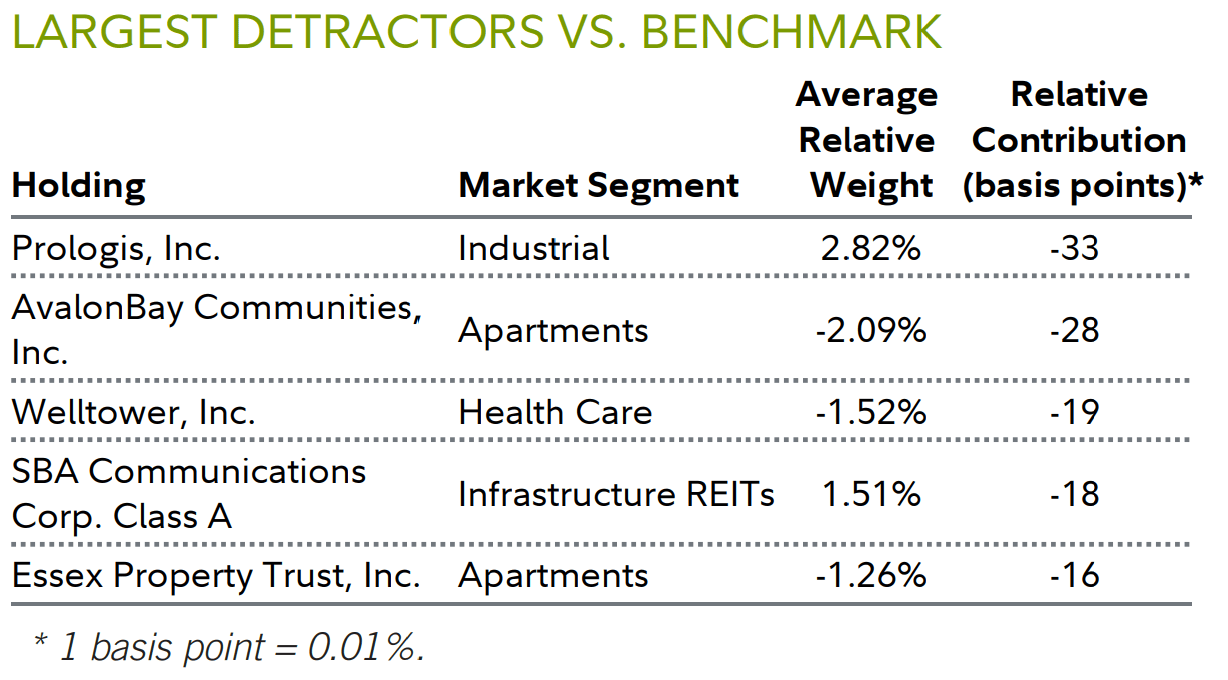
Also contributing to the fund’s relative performance in Q2 was an underweight in the lagging real estate services industry (-13%), as well as the fund’s positioning in the multi-family residential REITs group. In particular, overweights in apartment operators Apartment Income REIT (+19%), UDR (+11%) and Mid-America Apartment Community (MAA) (+10%) were notable contributors. Partly offsetting these gains, however, was our decision to avoid other multi-family residential REITs found in the benchmark we saw as offering a less-favorable risk-reward trade-off: AvalonBay Communities (AVB) and Essex Property Trust (ESS) (+12% each).
In contrast, the fund’s overweight in the lagging industrial REIT category (-11%) detracted from our relative result. Here, the biggest detractor was the fund’s overweight in Prologis (-13%), which as of June 30 was the largest position in both the portfolio and index. During the quarter, industrial REITs lagged due to Prologis’ cautious comments about demand for logistics space. We continued to maintain an overweight in Prologis, however, because we continued to see long-term opportunity in the industry.
Outlook and Positioning
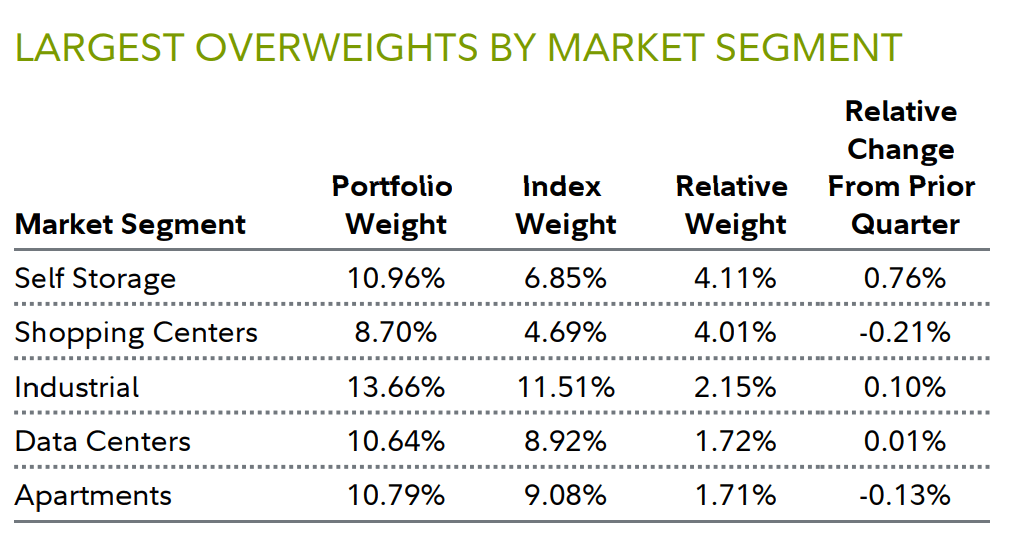
During the period, we moved the fund toward what we would term a cyclical recovery strategy. This involved investing in industries and stocks that we anticipated would benefit from a better near-term supply and demand environment. Specifically, this entailed growing exposure to the self-storage, apartment and industrial REIT sectors, all of which have seen elevated near-term supply with somewhat tepid demand. In all three categories – among our largest portfolio weights as of June 30 – we expected supply to fall meaningfully starting in early 2025 and for demand to improve, thus setting up these categories for a cyclical rebound.
Our exposure to self-storage, which grew modestly and finished the quarter at 11%, reflected our view that the industry’s fundamentals have likely troughed, making it possible to invest in the companies at discounted valuations. This creates what we see as an attractive opportunity, given that self-storage REITs, due to their strong growth rates and business models, historically have traded at a premium to the overall REIT market.
Meanwhile, the fund’s outsized exposure to apartment REITs reflected our view that the industry is well positioned over the long term. During Q2, higher-than-anticipated job growth and a low level of move-out activity due to high mortgage rates led to demand for apartments outpacing expectations. As a result, prior growth in rents has been maintained, even in the Sun Belt region, which has been absorbing a lot of supply. On June 30, 11% of the fund was invested in the apartment industry.
Meanwhile, we maintained substantial exposure to industrial REITs (about 14% of the fund at quarter end) due to continued strong demand for specialized distribution facilities, driven in part by rapid growth in e-commerce.
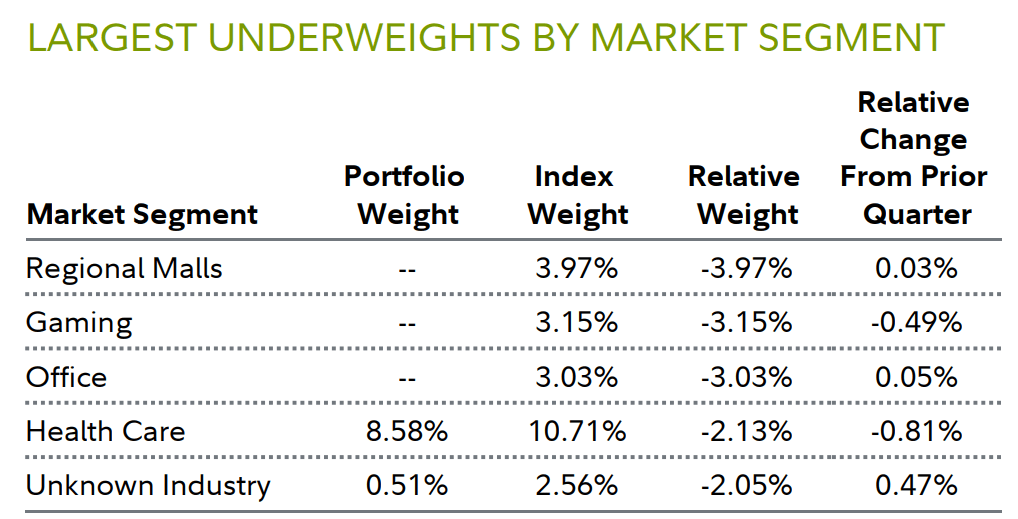
Meanwhile, we continued to avoid exposure to mall owners, given the significant long-term business challenges they face. With the rise in e-commerce, consumers increasingly are bypassing physical stores and receiving goods at their homes. We think this trend bodes negatively for many, though not all, retail property owners and well for owners of distribution and logistics facilities. There are no regional mall REITs in the fund as of midyear. However, we did see attractive opportunities among retail strip-center REITs and, as such, maintained an overweight in the industry. As we see it, owners of strip centers have much better businesses than mall owners, benefiting from favorable demand and more limited supply of attractive locations. We maintained a focus on grocery-anchored centers, whose more essential nature we believe makes them less vulnerable to long-term trends.
We also continued to hold no office REITs as of June 30. We saw offices as a poor business even before the pandemic. Now, we believe the situation has gotten even worse.
At the same time, we remain overweight data centers – which made up about 11% of the fund on June 30. It’s become increasingly challenging to satisfy the demand for data centers due to constraints on new supply, which include access to power and water resources and the scarcity of optimal locations. Many customers want to be close to the internet’s on- and off-ramps to make their data connections faster. Thus, well-located data centers are seeing particularly strong growth in their rental income. This situation is creating tremendous pricing power for the industry.
Looking ahead, we’re anticipating that the correlation we’ve been seeing between REITs’ performance and the direction of interest rates will likely persist until rates ultimately stabilize or fall. Furthermore, this recent – and, we hope, short-lived – tight relationship represents an undesirable situation for our largely bottom-up (stock-by-stock) investment process. However, we remain hopeful that when rates eventually do decline, REIT performance can once again begin to reflect individual company fundamentals and valuations.
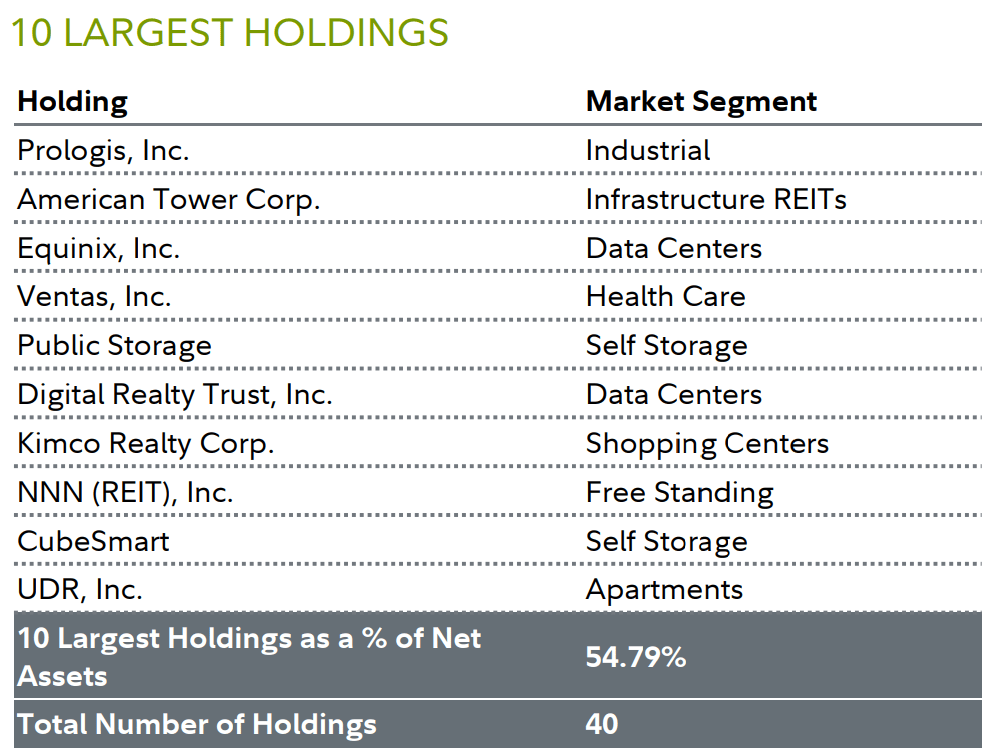
| The 10 largest holdings are as of the end of the reporting period, and may not be representative of the fund’s current or future investments. Holdings do not include money market investments. |
|
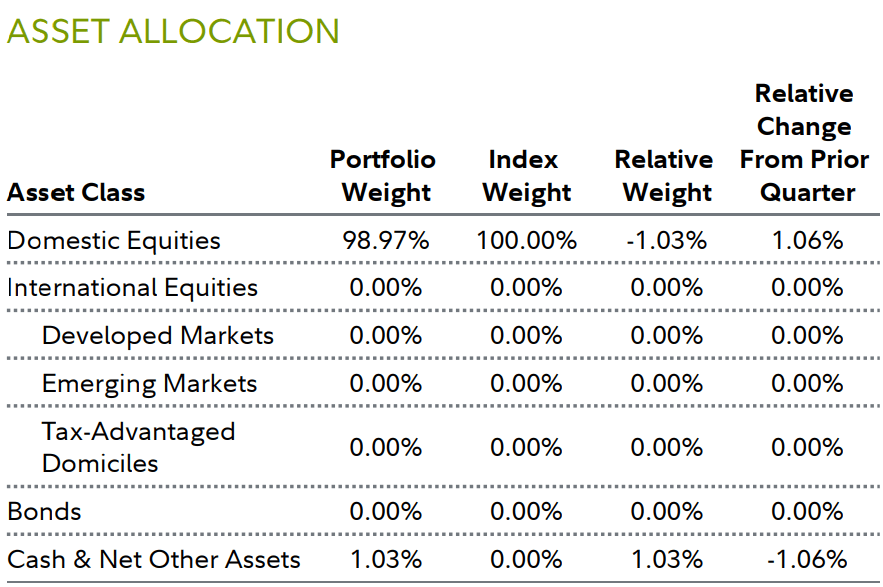
Net Other Assets can include fund receivables, fund payables, and offsets to other derivative positions, as well as certain assets that do not fall into any of the portfolio composition categories. Depending on the extent to which the fund invests in derivatives and the number of positions that are held for future settlement, Net Other Assets can be a negative number. “Tax-Advantaged Domiciles” represent countries whose tax policies may be favorable for company incorporation. |
|
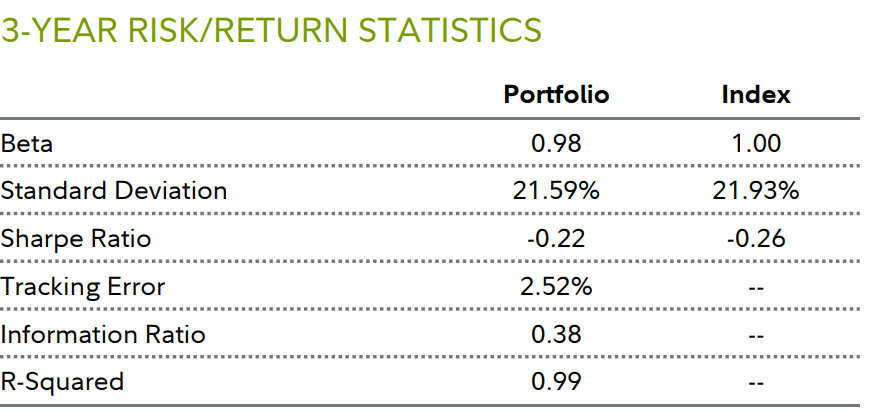
Fund Information Manager(s): Steve Buller Trading Symbol: FRESX Start Date: November 17, 1986 Size (in millions): $2,470.04 Morningstar Category: Fund Real Estate Stock markets, especially foreign markets, are volatile and can decline significantly in response to adverse issuer, political, regulatory, market, or economic developments. Foreign securities are subject to interest rate, currency exchange rate, economic, and political risks. Changes in real estate values or economic downturns can have a significant negative effect on issuers in the real estate industry. The value of securities of issuers in the real estate industry can be affected by changes in real estate values and rental income, property taxes, interest rates, tax and regulatory requirements, and the management skill and creditworthiness of the issuer. The fund may have additional volatility because it can invest a significant portion of assets in securities of a small number of individual issuers. Definitions and Important Information Information provided in, and presentation of, this document are for informational and educational purposes only and are not a recommendation to take any particular action, or any action at all, nor an offer or solicitation to buy or sell any securities or services presented. It is not investment advice. Fidelity does not provide legal or tax advice. Before making any investment decisions, you should consult with your own professional advisers and take into account all of the particular facts and circumstances of your individual situation. Fidelity and its representatives may have a conflict of interest in the products or services mentioned in these materials because they have a financial interest in them, and receive compensation, directly or indirectly, in connection with the management, distribution, and/or servicing of these products or services, including Fidelity funds, certain third-party funds and products, and certain investment services. Important Fund Information Relative positioning data presented in this commentary is based on the fund’s primary benchmark (index) unless a secondary benchmark is provided to assess performance. Indices It is not possible to invest directly in an index. All indices represented are unmanaged. All indices include reinvestment of dividends and interest income unless otherwise noted. S&P 500 Index is a market capitalization-weighted index of 500 common stocks chosen for market size, liquidity, and industry group representation to represent U.S. equity performance. MSCI US IMI Real Estate 25/50 Linked Index is a modified market capitalization-weighted index of stocks designed to measure the performance of real estate companies in the MSCI US Investable Market 2500 Index. Index returns shown for periods prior to October 1, 2020 are returns of the Dow Jones U.S. Select Real Estate Securities Index (RESI). Market-Segment Weights Market-segment weights illustrate examples of sectors or industries in which the fund may invest, and may not be representative of the fund’s current or future investments. They should not be construed or used as a recommendation for any sector or industry. Ranking Information © 2024 Morningstar, Inc. All rights reserved. The Morningstar information contained herein: (1) is proprietary to Morningstar and/or its content providers; (2) may not be copied or redistributed; and (3) is not warranted to be accurate, complete or timely. Neither Morningstar nor its content providers are responsible for any damages or losses arising from any use of this information. Fidelity does not review the Morningstar data and, for mutual fund performance, you should check the fund’s current prospectus for the most up-to-date information concerning applicable loads, fees and expenses. % Rank in Morningstar Category is the fund’s total-return percentile rank relative to all funds that have the same Morningstar Category. The highest (or most favorable) percentile rank is 1 and the lowest (or least favorable) percentile rank is 100. The top-performing fund in a category will always receive a rank of 1%. % Rank in Morningstar Category is based on total returns which include reinvested dividends and capital gains, if any, and exclude sales charges. Multiple share classes of a fund have a common portfolio but impose different expense structures. Relative Weights Relative weights represents the % of fund assets in a particular market segment, asset class or credit quality relative to the benchmark. A positive number represents an overweight, and a negative number is an underweight. The fund’s benchmark is listed immediately under the fund name in the Performance Summary. 3-Year Risk/Return Statistics Beta is a measure of the volatility of a fund relative to its benchmark index. A beta greater (less) than 1 is more (less) volatile than the index. Information Ratio measures a fund’s active return (fund’s average monthly return minus the benchmark’s average monthly return) in relation to the volatility of its active returns. R-Squared measures how a fund’s performance correlates with a benchmark index’s performance and shows what portion of it can be explained by the performance of the overall market/index. R-Squared ranges from 0, meaning no correlation, to 1, meaning perfect correlation. An R-Squared value of less than 0.5 indicates that annualized alpha and beta are not reliable performance statistics. Sharpe Ratio is a measure of historical risk-adjusted performance. It is calculated by dividing the fund’s excess returns (the fund’s average annual return for the period minus the 3-month “risk free” return rate) and dividing it by the standard deviation of the fund’s returns. The higher the ratio, the better the fund’s return per unit of risk. The three month “risk free” rate used is the 90-day Treasury Bill rate. Standard Deviation is a statistical measurement of the dispersion of a fund’s return over a specified time period. Fidelity calculates standard deviations by comparing a fund’s monthly returns to its average monthly return over a 36-month period, and then annualizes the number. Investors may examine historical standard deviation in conjunction with historical returns to decide whether a fund’s volatility would have been acceptable given the returns it would have produced. A higher standard deviation indicates a wider dispersion of past returns and thus greater historical volatility. Standard deviation does not indicate how the fund actually performed, but merely indicates the volatility of its returns over time. Tracking Error is the divergence between the price behavior of a position or a portfolio and the price behavior of a benchmark, creating an unexpected profit or loss. Before investing in any mutual fund, please carefully consider the investment objectives, risks, charges, and expenses. For this and other information, call or write Fidelity for a free prospectus or, if available, a summary prospectus. Read it carefully before you invest. Past performance is no guarantee of future results. Views expressed are through the end of the period stated and do not necessarily represent the views of Fidelity. Views are subject to change at any time based upon market or other conditions and Fidelity disclaims any responsibility to update such views. These views may not be relied on as investment advice and, because investment decisions for a Fidelity fund are based on numerous factors, may not be relied on as an indication of trading intent on behalf of any Fidelity fund. The securities mentioned are not necessarily holdings invested in by the portfolio manager(s) or FMR LLC. References to specific company securities should not be construed as recommendations or investment advice. Diversification does not ensure a profit or guarantee against a loss. S&P 500 is a registered service mark of Standard & Poor’s Financial Services LLC. Other third-party marks appearing herein are the property of their respective owners. All other marks appearing herein are registered or unregistered trademarks or service marks of FMR LLC or an affiliated company. Fidelity Brokerage Services LLC, Member NYSE, SIPC, 900 Salem Street, Smithfield, RI 02917. Fidelity Distributors Company LLC, 500 Salem Street, Smithfield, RI 02917. © 2024 FMR LLC. All rights reserved. Not NCUA or NCUSIF insured. May lose value. No credit union guarantee. 656358.48.0 |
Editor’s Note: The summary bullets for this article were chosen by Seeking Alpha editors.